Capturing revenue with Leanbase
See the Money: Capturing Revenue with Leanbase
You’ve set up the basics of your Leanbase integration — now it’s time to connect what matters most: revenue.
While analytics around activation or retention can be nuanced, revenue is binary.
Either a user has paid you, or they haven’t.
Leanbase gives you two primary ways to capture and analyze revenue:
Manual revenue capture through tracked events
Automated revenue capture via the data warehouse
Option 1 – Manual Revenue Capture
Manual revenue tracking starts where the transaction happens — at the moment money changes hands.
How to Capture It
Instrument an event at the point of payment (e.g., checkout success, subscription purchase).
Attach key metadata as event properties — such as price, currency, duration, and product details.
Example:
leanbase.capture('subscription_purchased', {
months: 12,
price: 1999, // in cents, equivalent to $19.99
currency: 'USD', // ISO 4217 currency code
coupon: 'SUMMER2024', // optional but useful if using discounts
product_id: 'prod_1234', // unique product identifier
subscription_id: 'sub_1234' // unique subscription identifier
})
💡 Tip:
Keep property values strictly numeric (e.g.,months: 12instead ofterm: "12_months") to make aggregation and reporting easier later.
Even if your product catalog is simple today, record details like product IDs and price now.
This ensures historical comparability when you expand, experiment, or change pricing in the future.
Map the Purchase Path
Think through the actions that lead up to payment — what users must do before checkout.
Track these events too.
For example:
clicked_upgrade_buttonopened_pricing_pageapplied_coupon
Adding metadata to each event (like price or plan type) creates richer reports later.
If you have an upsell or CTA that displays a specific price, include that as an event property as well.
Option 2 – Automating Revenue Capture with the Data Warehouse
As your business grows, revenue data often lives across multiple services — your app, Stripe, Chargebee, or even spreadsheets.
Instead of manually wiring complex event pipelines, Leanbase lets you pull data directly into your data warehouse and analyze everything in one place.
How It Works
Leanbase aggregates data from multiple sources automatically.
You can sync revenue events from Stripe, Chargebee, or your app database.
Access all revenue metrics directly from the Revenue Analytics Dashboard.
Build custom insights combining revenue and product usage data for deeper correlation.
This setup keeps your revenue data fresh and automatically aligned with user behavior in Leanbase — no manual syncs required.
⚙️ Just don’t forget to continue tracking the events leading to revenue, so you can connect behavior to outcomes.
Planning Revenue Reporting
Before reporting on revenue, clarify your setup:
Will you use manual events or data warehouse syncs?
Which events generate revenue — and are they already tracked?
Do you need to capture additional metadata (plan, price, product type)?
Revenue Reporting
Once revenue data is flowing, Leanbase gives you two main ways to visualize it:
1. Revenue Analytics Dashboard
Leanbase’s Revenue Analytics Dashboard (currently in beta) provides an instant overview of revenue trends, including:
Total revenue over time
Growth rate and customer lifetime value
-
Comparison across cohorts, products, or campaigns
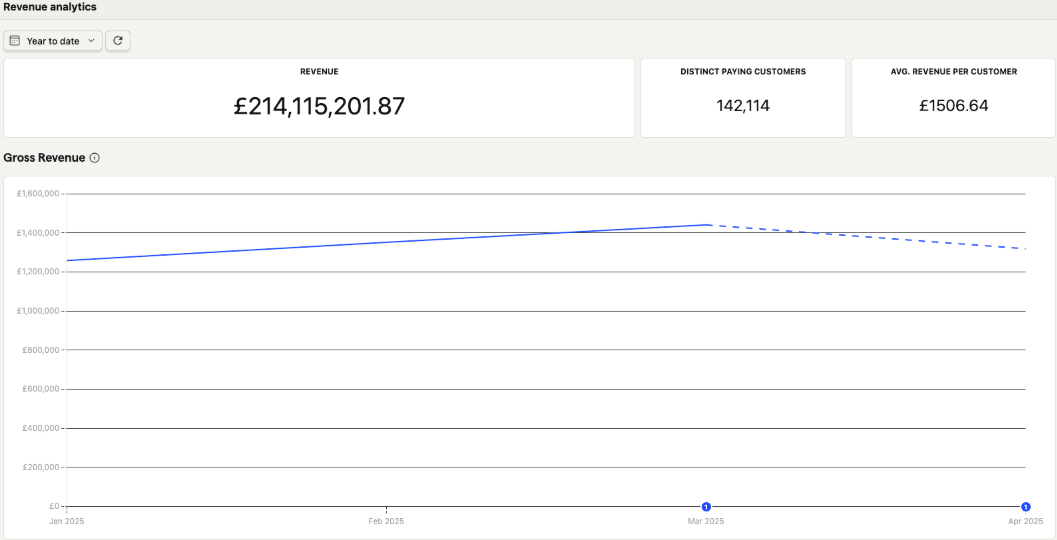
📈 Revenue analytics is continuously improving — stay tuned for more advanced insights and forecasting features.
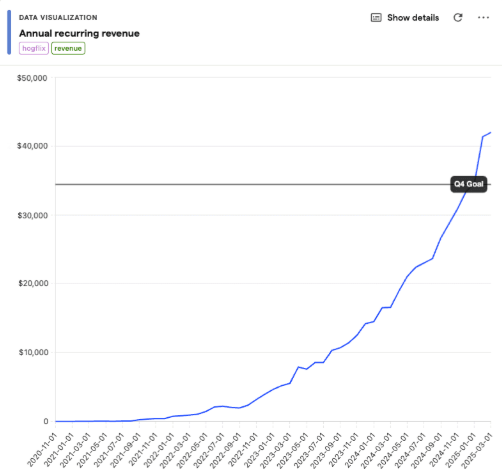
2. Build a Custom Trend Insight
You can also use a Trends Insight to create custom revenue visualizations.
To create one:
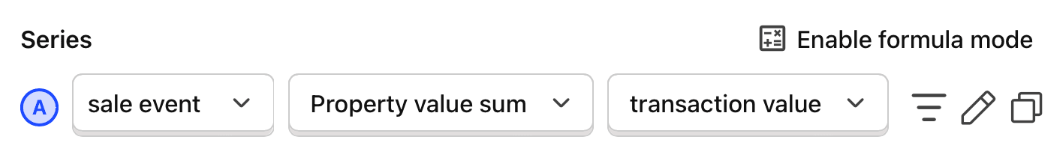
Create a new Trends Insight.
Select your revenue-bearing event (e.g.,
subscription_purchased).In the aggregation menu, choose Property value → Sum.
In the next menu, select the property representing your revenue (e.g.,
price).
You’ll get a trend chart showing total revenue over time, with options to group results hourly, daily, weekly, or monthly — and compare against previous periods.
Your Product in One Dashboard
Once revenue and all your key product events are captured, you can bring them together in a single dashboard to visualize:
Growth in daily, weekly, or monthly active users
Conversion from signup to activation
Retention after activation
Revenue trends relative to goals
In short: everything that matters to your business, all in one view.