What is Feedback analysis?
The Feedback Analysis insight in Leanbase adds a semantic layer on top of your feedback data — turning unstructured messages into actionable insights about product health, user sentiment, and people correlations.
It helps you understand what users are saying — and why it matters — by automatically organizing feedback into topics, modules, and impact rankings.
You can then drill down into any topic, explore related user segments, or chat with AI to reveal deeper causes and opportunities.
Creating a Feedback Analysis
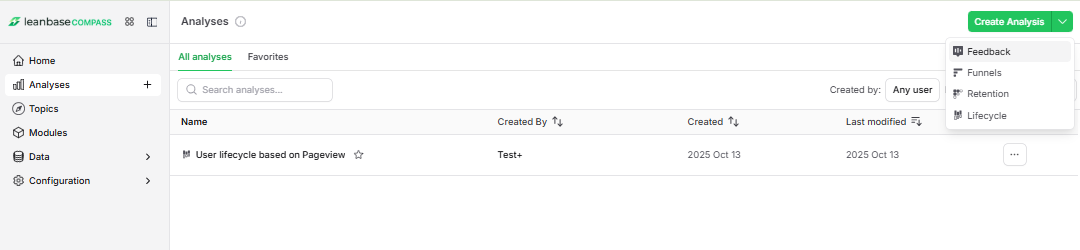
Go to Analytics in the left sidebar.
Click Create Analysis.
Select the Feedback Analysis.
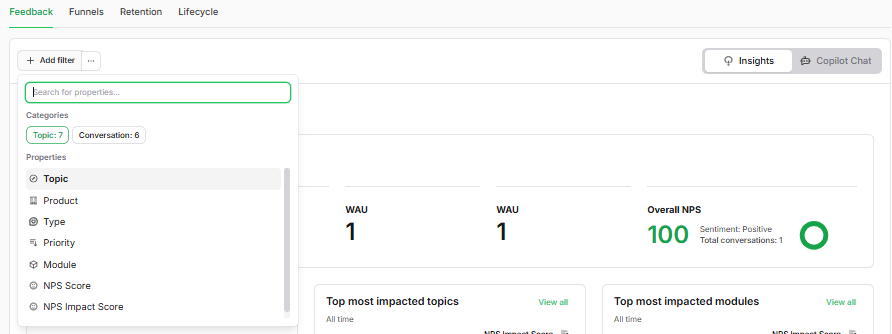
Add context to Feedback Analysis.
What It Does
Feedback Analysis helps you answer questions like:
What are the top pain points users mention this week?
Which modules or features generate the most feedback?
How is product sentiment trending over time?
Which user groups report the most issues or requests?
Are product issues correlated with specific lifecycle stages (e.g., new users churn faster due to onboarding friction)?
This insight helps PMs, UX researchers, and leadership teams monitor product health, prioritize fixes, and align roadmap decisions with user needs.
How It Works
Impact Ranking
Leanbase automatically scores each topic and module by:
User Impact — how strongly feedback in this area affects user experience
Volume — number of related mentions across all feedback
Sentiment Intensity — how positive or negative the feedback is
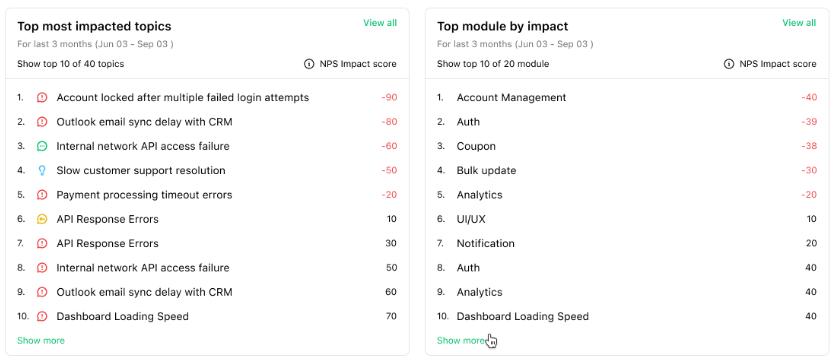
This creates a ranked list of topics and modules that show where your team should focus next.
Health Overview
All rankings are aggregated into a Product Health Overview, visualizing how different areas of your product perform based on user sentiment.
You can quickly see:
Which modules generate the most positive feedback
Which areas show signs of recurring issues or dissatisfaction
Whether recent updates improved or worsened user perception
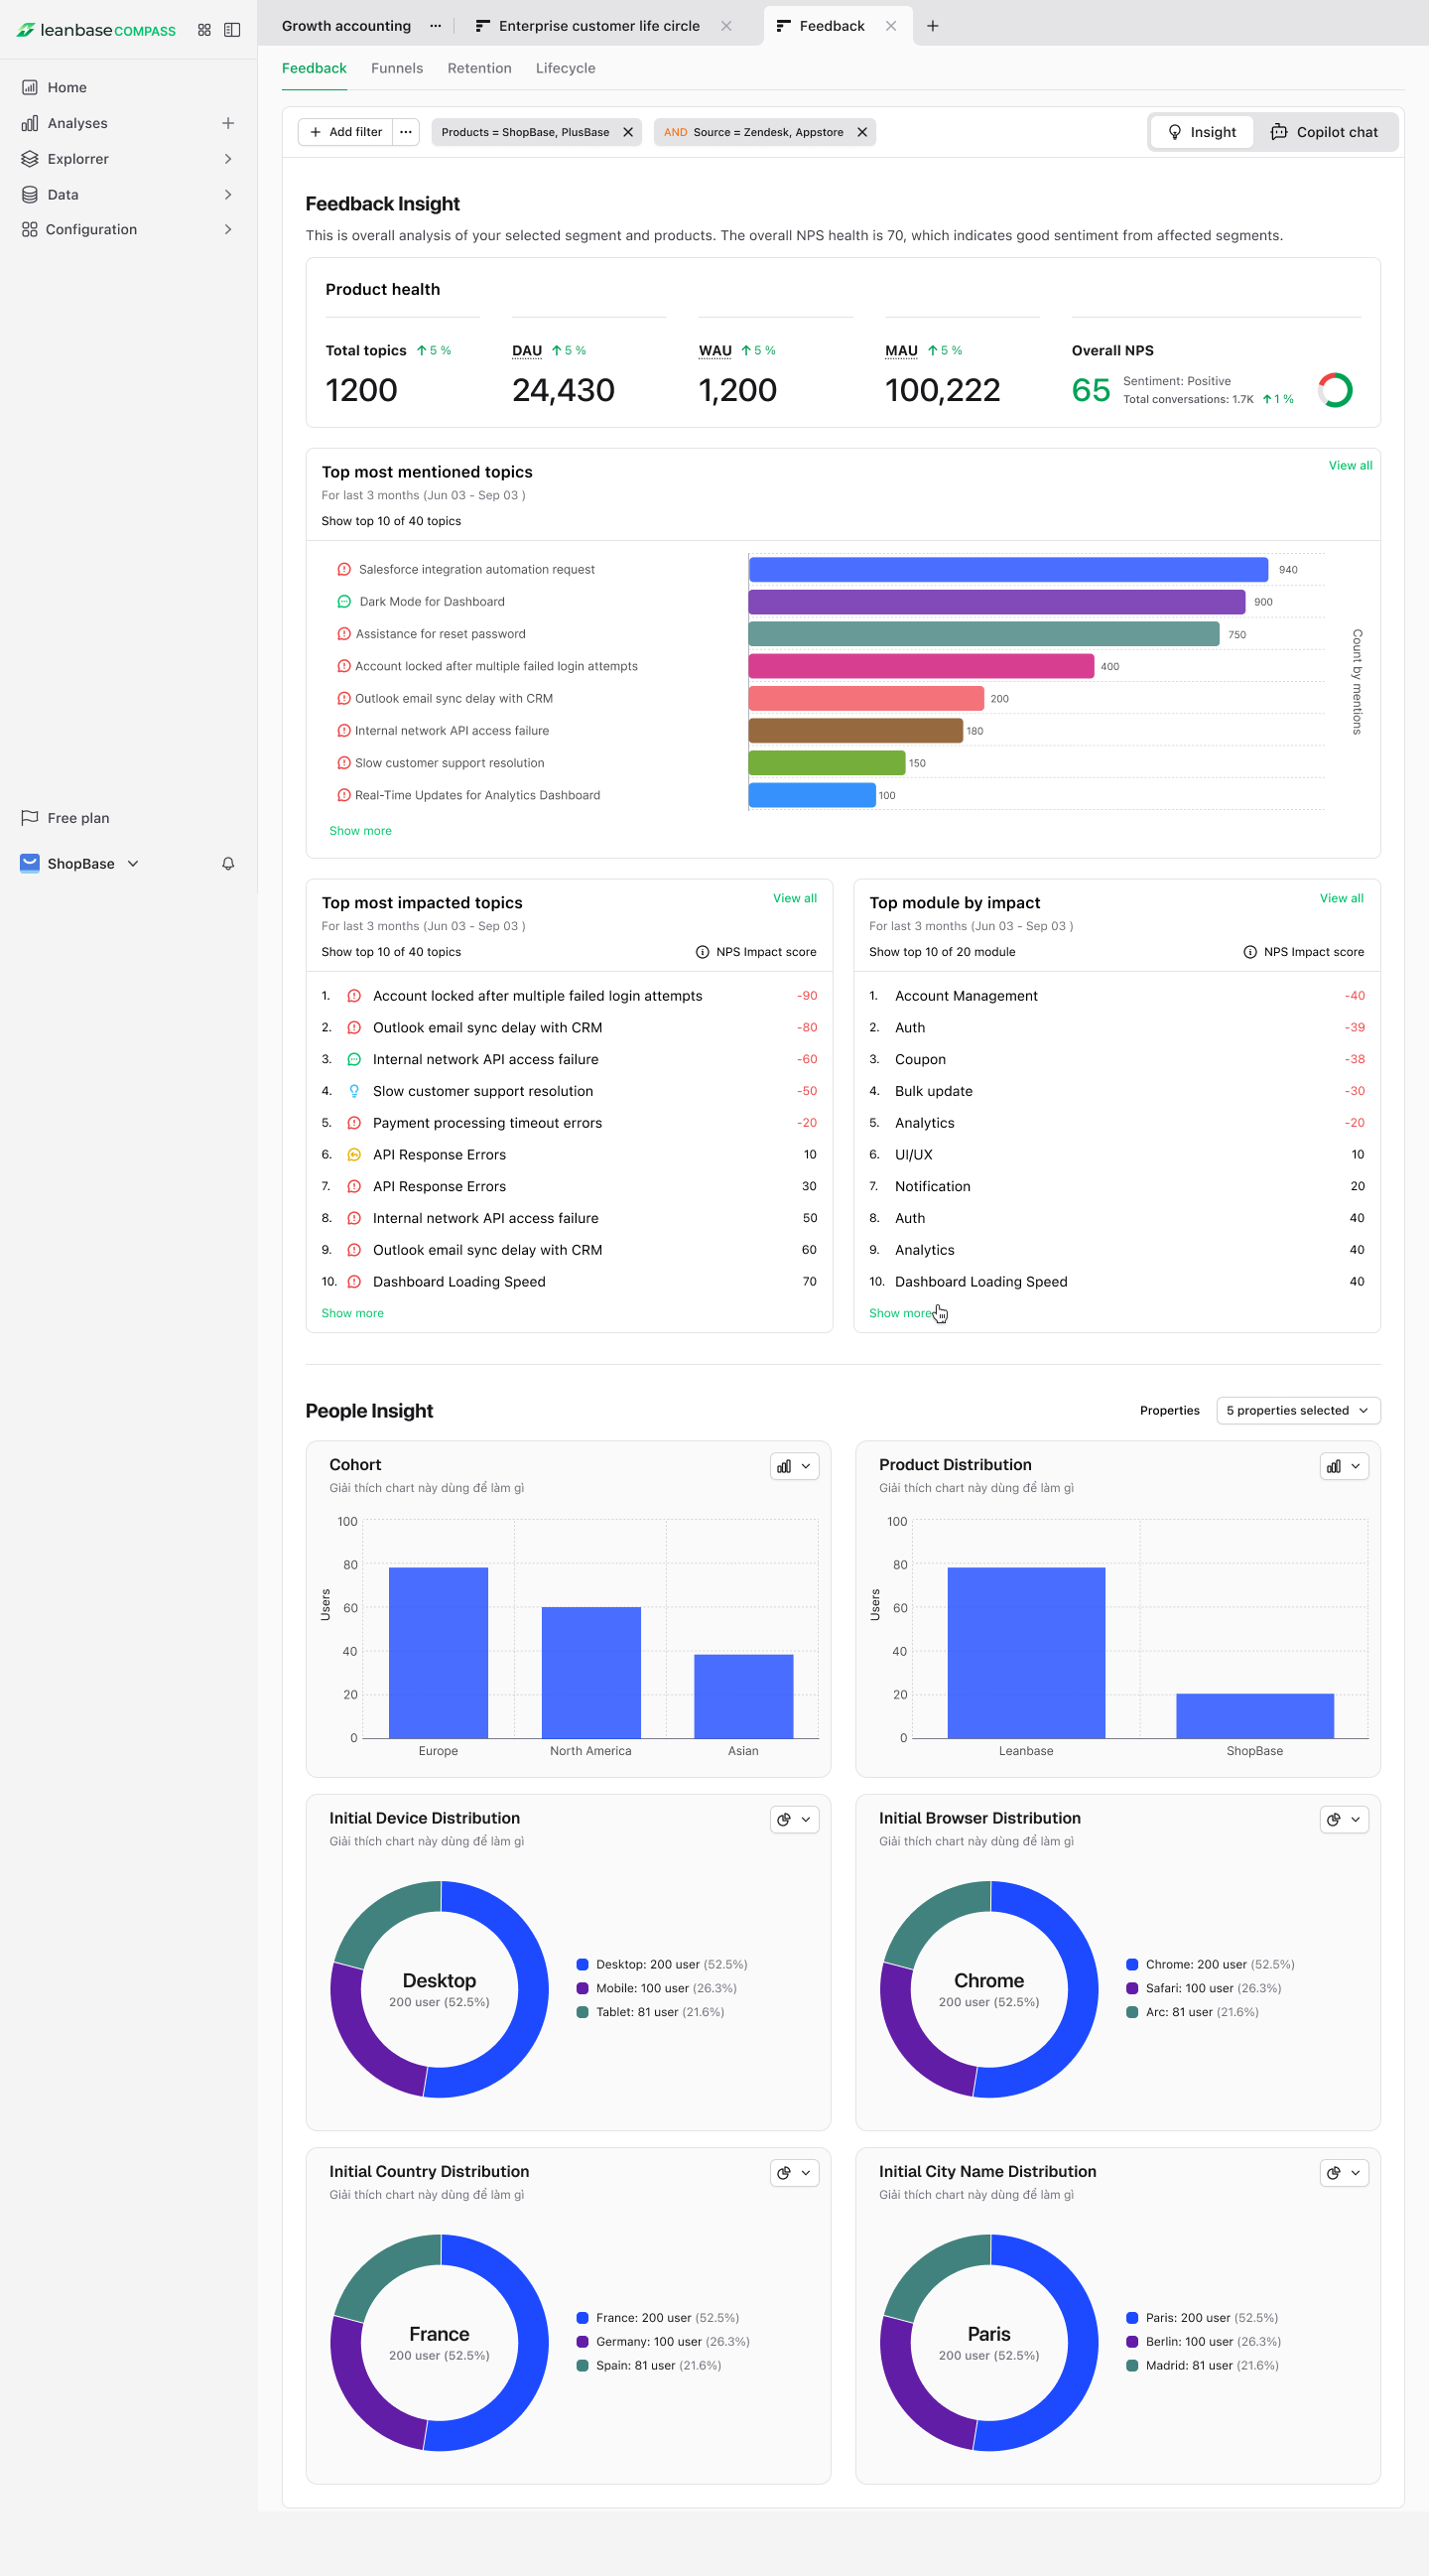
People Correlation Insights
Feedback Analysis connects qualitative insights with product metrics:
People Insights Correlation – See how specific cohorts (e.g., power users, churned users) align with certain topics.
People Properties Correlation - See how specific cohorts (e.g., power users, churned users) share same properties.
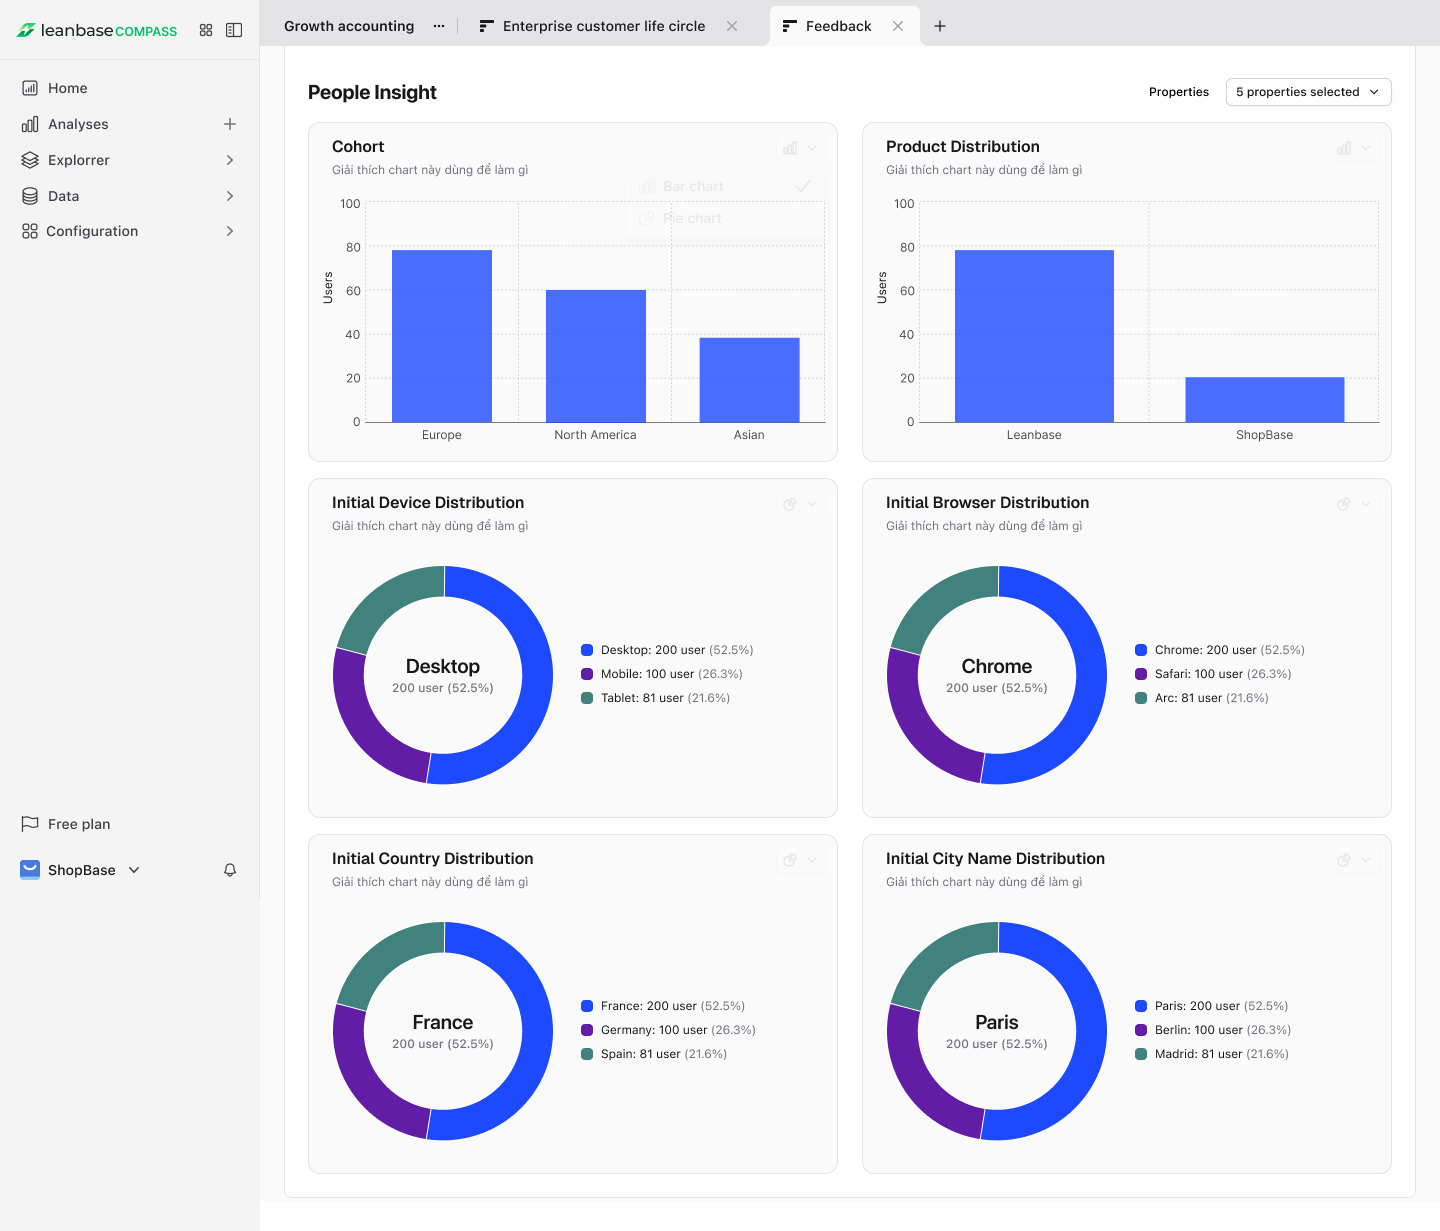
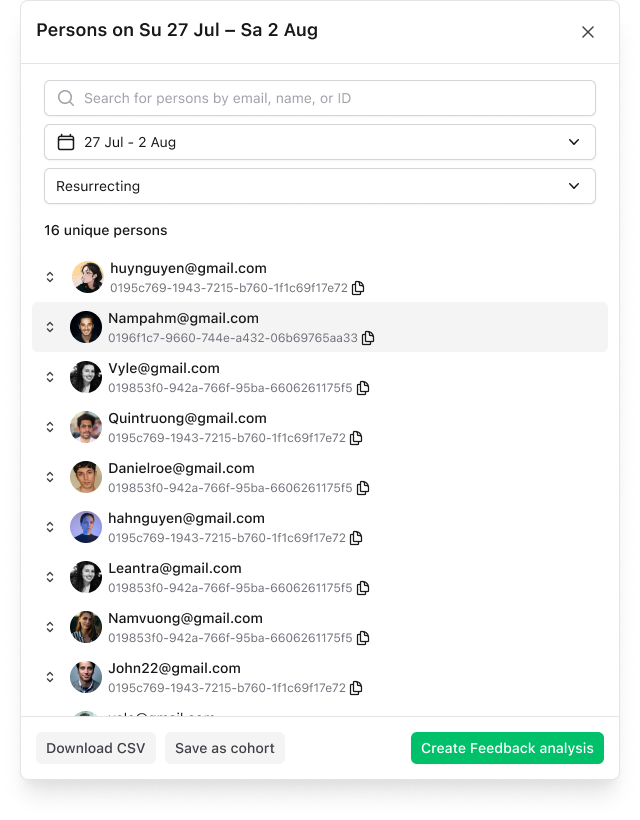
Click on chart to open people details, in which you can:
Create a Cohort for deeper follow-up analysis
Export feedback clusters to your issue tracker
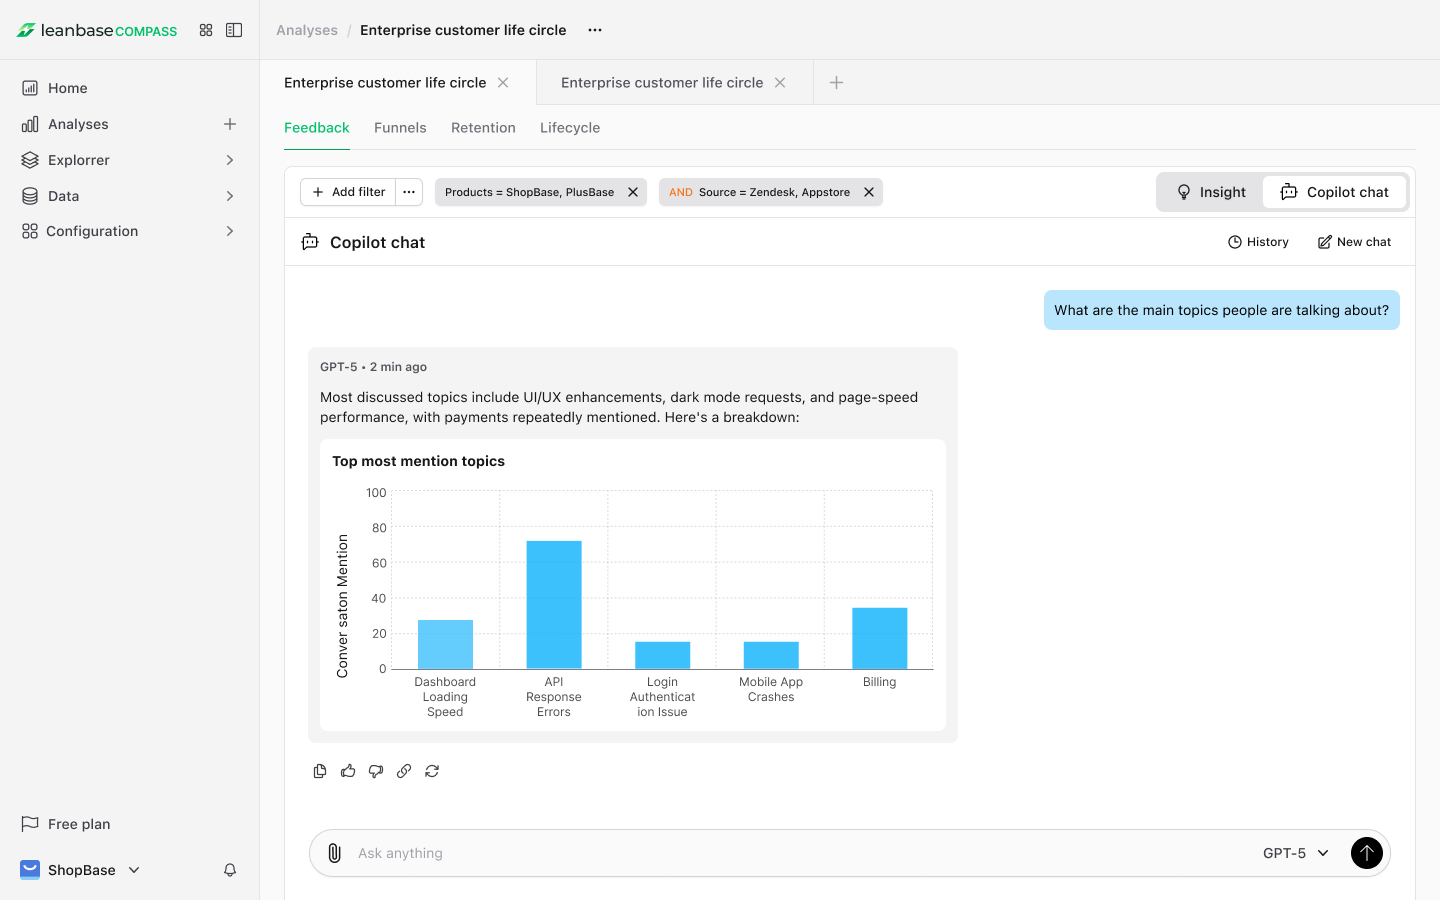
Use Copilot Chat to dig deeper into your analysis:
“Show me top feature requests by Pro plan users.”
“Summarize all negative feedback about dashboard performance.”
“What’s the most mentioned issue in the last 7 days?”
“Cluster all messages related to ‘export’ or ‘reporting’.”
Copilot helps you generate insights faster, filter complex feedback, and surface action items automatically.
Example Use Cases
Detect rising negative sentiment about a new onboarding flow before churn increases
Identify which module most influences positive NPS among active users
Compare feedback patterns between new and returning users
Generate AI summaries for leadership reports or sprint reviews