What is People Analysis?
People Analysis enables you to understand how different groups of users, customers, or feedback segments behave, perform, or feel about your product.
Each segment represents a subset of people or feedback entries that share something in common — such as similar behaviors, feedback sentiment, or user attributes.
Here are a few examples of the segments you can analyze:
Users who reported similar issues or pain points.
Customers who gave negative feedback in the last week.
Users from the same country or company.
Feedback from premium vs. free users.
Feedback with similar AI-detected topics (e.g. “checkout bug”, “slow loading”, “pricing confusion”).
Segment Analysis helps you identify patterns and root causes across different cohorts of feedback or users, turning qualitative signals into actionable insights.
Where can you find People Analysis?
You can access People Analysis by navigating to:
Analysis → Feedback Analysis → Insights
From this page, you can:
View all existing segments and their related metrics (feedback volume, sentiment, recurrence, etc.)
Drill down into People Insights, which show user-level data contributing to that segment.
Switch between View Insights and AI Copilot to explore deeper insights or ask analytical questions about each segment.

What can you do with People Analysis?
You can use People Analysis to:
Discover the most common problems users mention in feedback.
Group similar feedback into AI-generated clusters (segments).
Track how frequently issues appear over time.
Compare different segments (e.g., “Checkout issues” vs. “UI feedback”) by sentiment or user type.
Identify which user segments are most impacted by recurring issues.
Understand relationships between feedback topics, customer cohorts, and product usage.
You can also use segment analysis to answer questions like:
“Which user group is reporting the most issues about performance?”
“Has negative sentiment in the ‘Billing’ segment increased recently?”
“What types of users are most likely to mention onboarding problems?”
“Which feedback themes are trending this week?”
How is People Analysis different from Cohorts?
Although both deal with grouping, they serve different purposes:
Aspect |
Cohorts |
People Analysis |
|---|---|---|
Focus |
Users with shared properties or behaviors |
Feedback grouped by AI or rule-based similarity |
Entity type |
Person-level |
Feedback-level |
Purpose |
Track user activity or retention |
Understand topics, pain points, and trends |
Data source |
Events & person properties |
Feedback text, metadata, and AI categorization |
Creation method |
Manual or rule-based |
AI-driven or filter-based in Feedback Analysis |
If your goal is to understand why users behave or feel a certain way, People analysis gives the contextual layer beyond raw cohort data.
How to explore Segment Analysis
Method 1: From Feedback Analysis
Go to Analysis → Feedback Analysis.
Leanbase automatically groups feedback into cohorts based on AI clustering and keyword similarity.
Click on any people insight chart data to open its detail.
-
From there, you can:
View list of people
Download CSV of list people
Save as new cohort
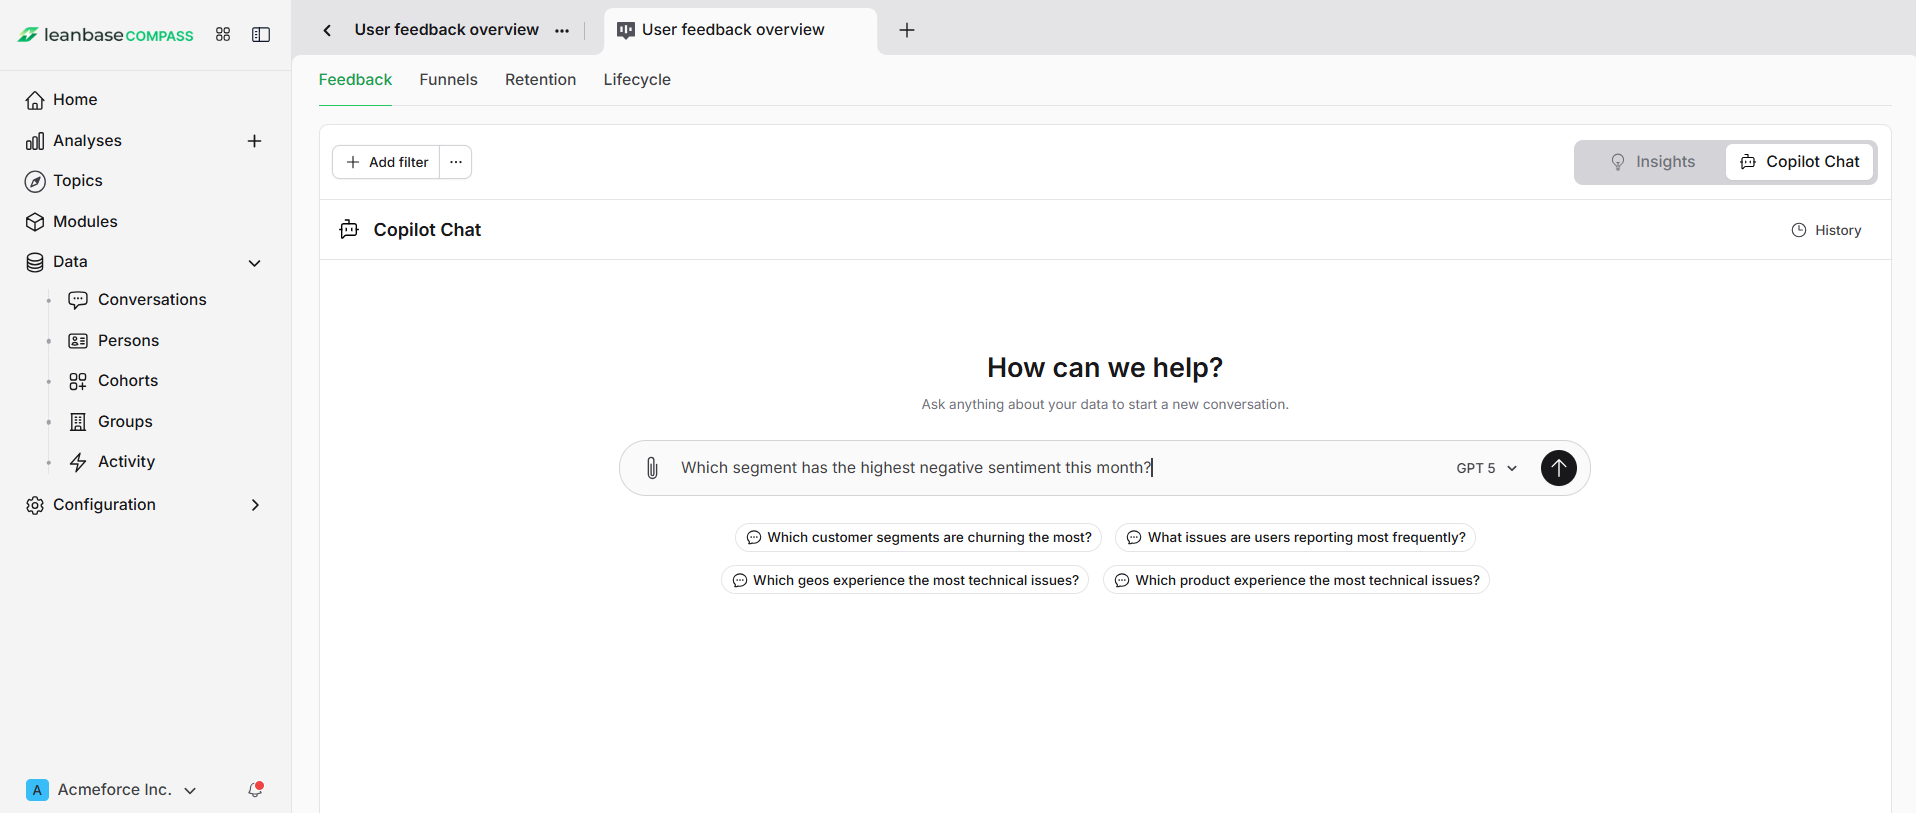
Method 2: Using AI Copilot
In Feedback Analysis, toggle the switch from View Insights → AI Copilot.
-
Ask questions like:
“Which segment has the highest negative sentiment this month?”
“Show me feedback trends for users in the ‘Performance Issues’ segment.”
“Which new segments emerged in the last 7 days?”
The Copilot will analyze segment data and visualize results directly on the dashboard.
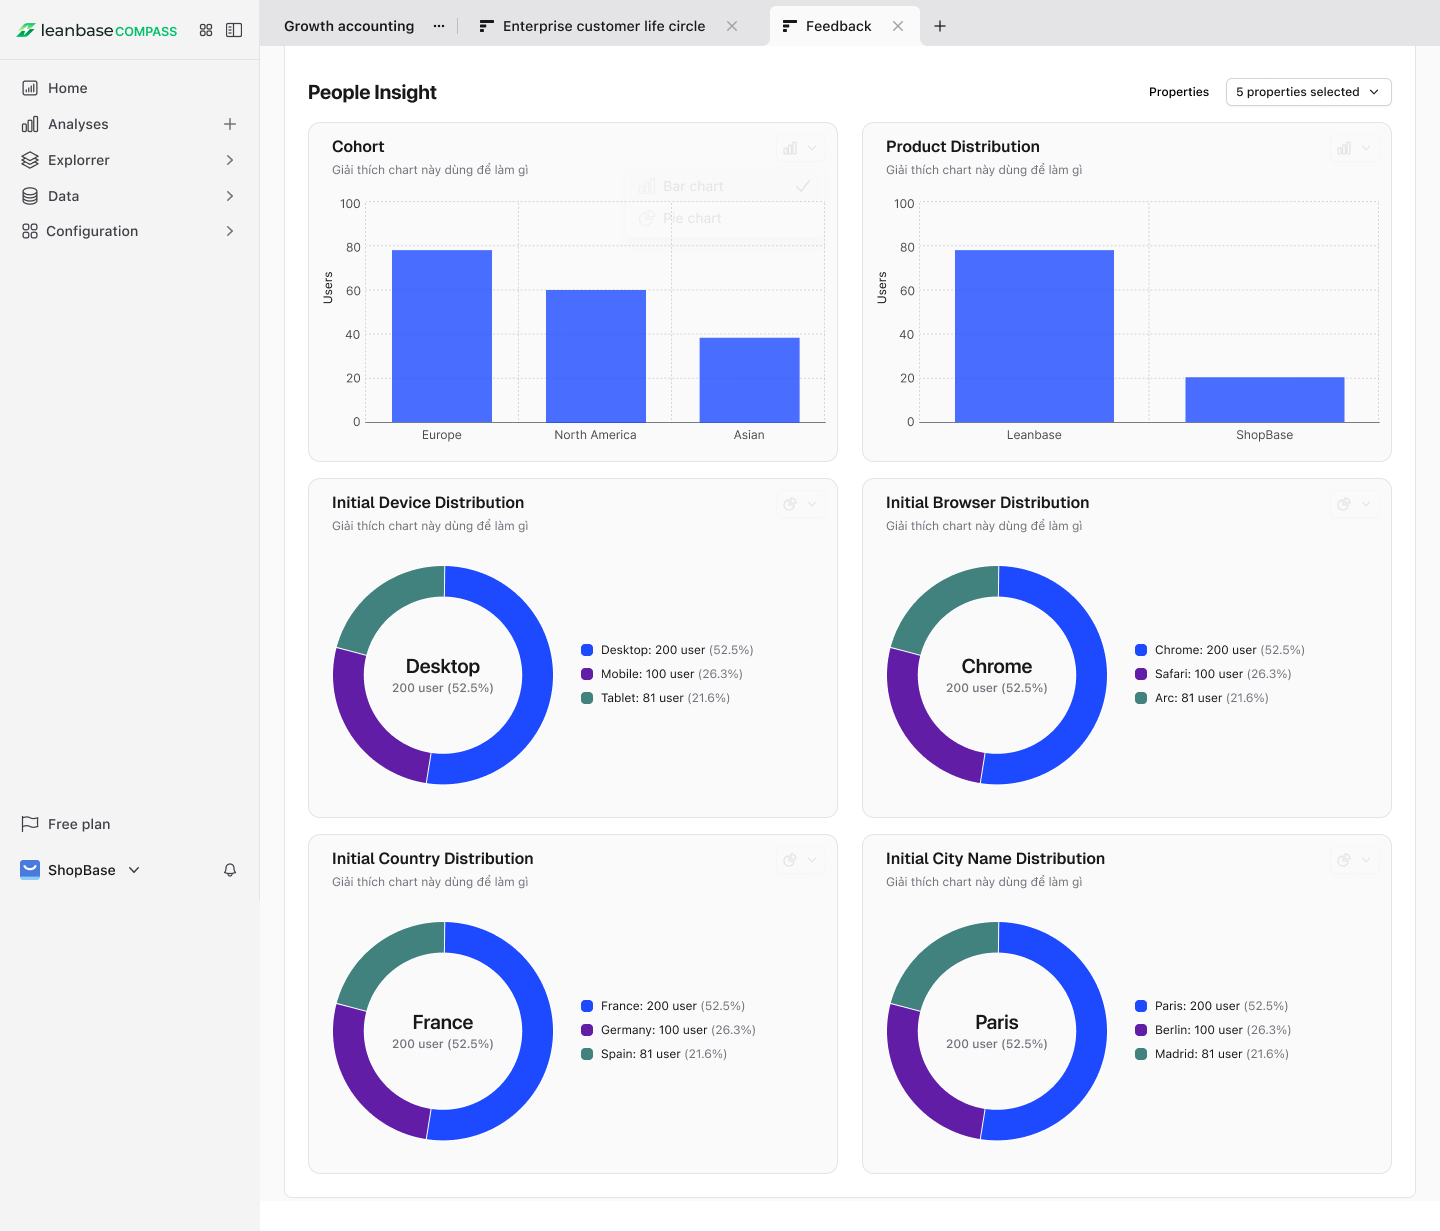
People Insights
Leanbase offer users a set of default charts divided by properties, you can add more properties for charts analysis shown:
Cohort: Number of people in each cohorts
Product Distribution: Number of people use each products
Initial Device Distribution: The baseline breakdown of user devices (e.g., desktop, mobile, tablet) at the start of a measurement period.
Initial Browser Distribution: The baseline breakdown of user browsers at the start of a measurement period.
Initial Country Distribution: The baseline breakdown of users by country at the start of a measurement period.
Initial City Name Distribution: The baseline breakdown of users by city at the start of a measurement period.