Correlation analysis
Correlation analysis is a funnels feature that automatically surfaces the key factors influencing conversion rates.
While funnels let you manually compare conversion rates across different user properties using the breakdown feature, that approach assumes you already know which property to examine. Correlation analysis removes the guesswork by automatically identifying the most impactful events or properties.
For example, the insight below shows that desktop users were 1.3x more likely to convert than mobile or tablet users. It also highlights that users who completed the uploaded_cv_for_review event during the funnel were 8.0x more likely to convert.
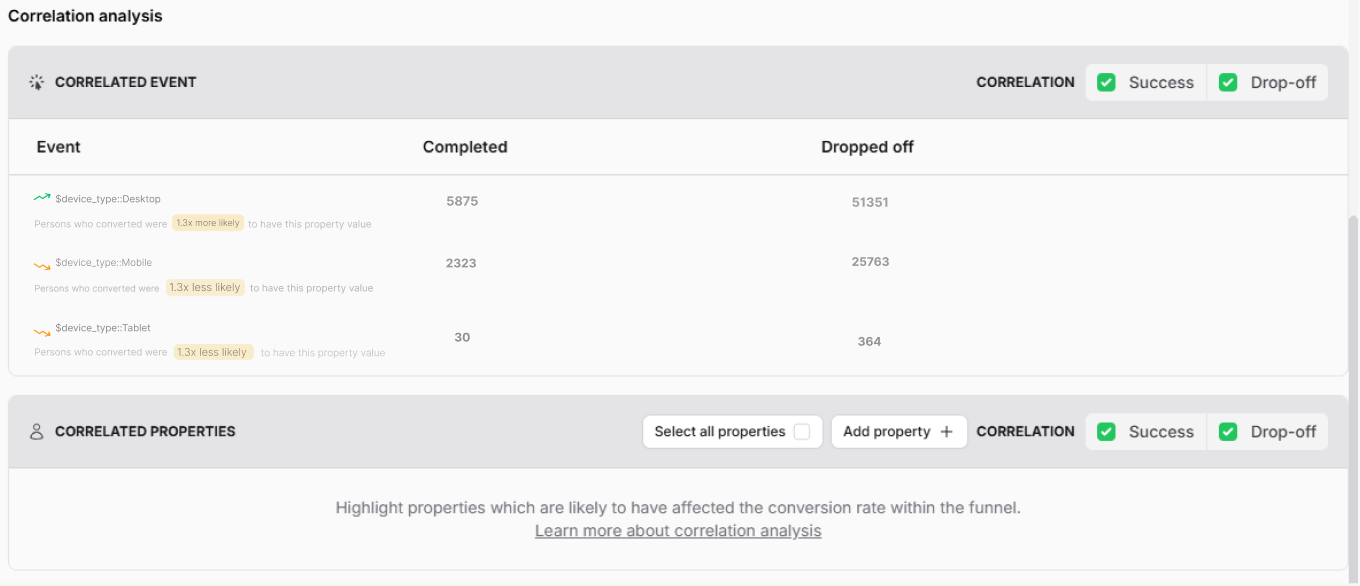 Note: The reliability of a correlation depends heavily on the sample size. If only a small number of users match a correlation, the result is likely to be inaccurate.
How to create a correlation analysis
Within any funnel insight, scroll to the Correlation analysis section and click Load results or Select properties.
Once results are generated, you can also build cohorts directly from the analysis: just click the numbers in the Completed or Dropoff columns, then select Save as cohort in the modal.
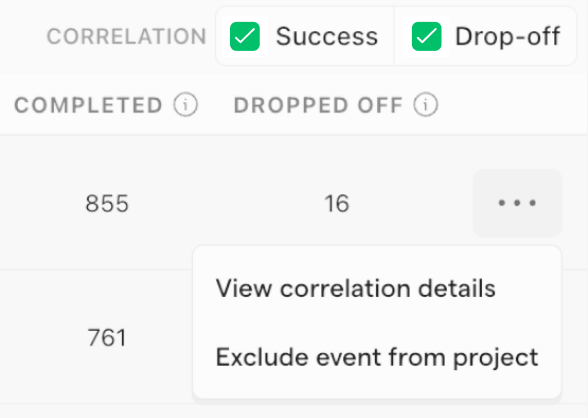
Excluding events or properties
Not every signal is useful. Some events or properties may be trivial or provide little actionable insight. Since you know your product best, you can decide what to exclude.
To remove these from correlation insights, click the … (more options) button and select Exclude event from project.